A Public View Into Unmanned Systems in the Ocean
Liquid Robotics — July 13, 2017
Seeing what unmanned systems can do in the ocean is important on many levels. When coupled with data access, this type of transparency encourages collaboration, inspires new ideas, and demonstrates what is possible as both manned and unmanned systems work together. The digital life we take for granted on land does not yet exist in the ocean. Both individual institutions and transnational groups are working to break down silos, share data broadly, establish standards, and improve communication across both people and ocean systems. A host of new technologies, including unmanned systems, should help to accelerate our journey to a more connected and digital ocean, one that we can understand and manage more effectively.
A More Digital, Accessible, and Transparent Ocean
So, with all the excitement and progress around unmanned systems in the ocean, where can we turn to for visibility into the actual missions performed and data collected from those missions? Luckily, scientists and researchers, who collaborate across domestic and international borders in both formal and ad-hoc ways, often seek to share both activities and the data they have collected.
When we make it easier to better understand the missions and access data collected from unmanned surface vehicles (USVs), many people benefit. It enables curious observers, scientists, and even application developers to do everything from visualizing missions to building models. Here we’ll look at different approaches to sharing Wave Glider mission activity and the data collected from three organizations: the Ocean Tracking Network (OTN) in Canada, GEOMAR in Germany, and the Monterey Bay Aquarium Research Institute (MBARI) in the US.
Ocean Tracking Network (OTN) – Missions, Maps, and Data
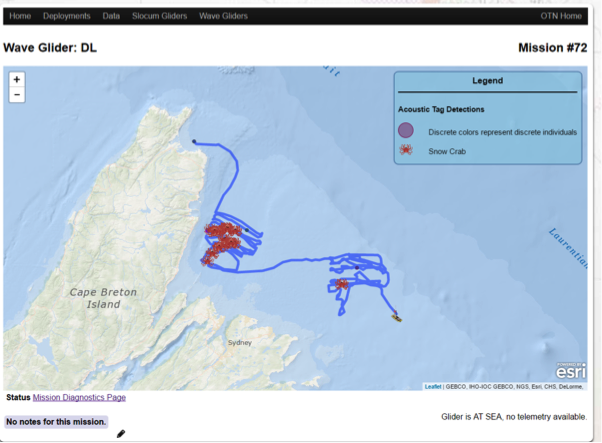
Since 2008, OTN at Dalhousie University in Halifax, Nova Scotia, has been deploying acoustic receivers and oceanographic monitoring equipment in key ocean locations and inland waters around the world. Several years ago, they decided to use a Wave Glider to efficiently and cost-effectively pull data on fish detections from acoustic receiver stations attached to the ocean floor and more recently to other mammals. In addition to tag data, the Wave Gliders typically collect biological data as well. And when they’re not busy on these jobs, they embark on other missions with other sensors.
OTN shares mission maps and tagged animals, in near real-time, as well as vehicle telemetry for both surface and underwater vehicle (buoyancy gliders) on a public portal. As of today, they have 2 live missions occurring that show the course of vehicles as well as Wave Glider detected tags along the way. The portal also provides select vehicle vitals (aka diagnostic telemetry) including power and battery, graphically displayed and updated in near real time as the Wave Glider progresses along its various missions.
GEOMAR (Germany)
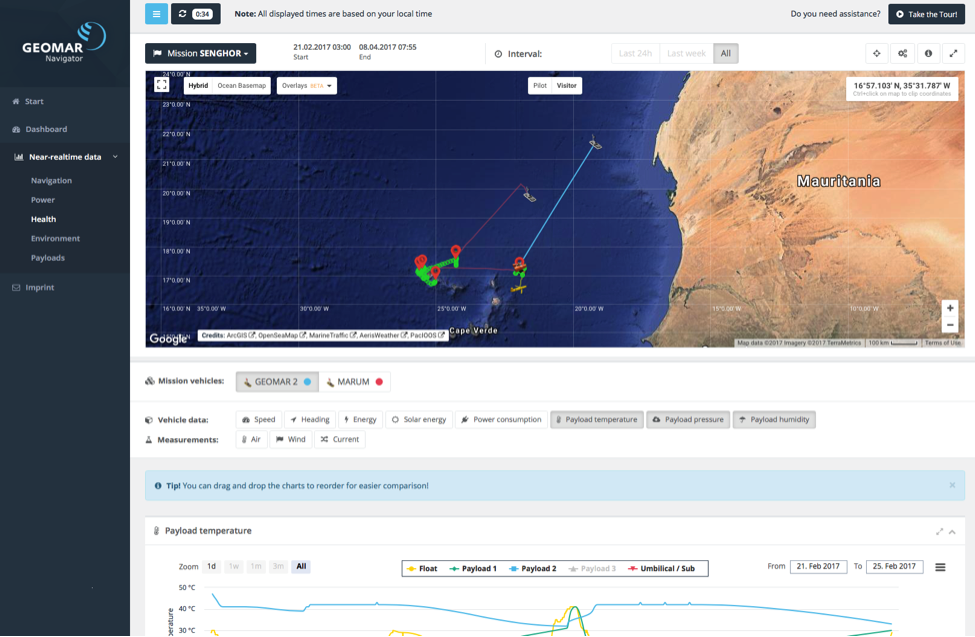
GEOMAR Helmholtz Centre for Ocean Research in Kiel has several Wave Gliders and different portals depending on the type of data you want. One unique web-based portal, called GEOMAR Navigator, tracks Wave Glider missions and recent data from those missions. The Navigator portal was developed as part of a scientific cooperation with Oman where future missions with Wave Gliders will occur.
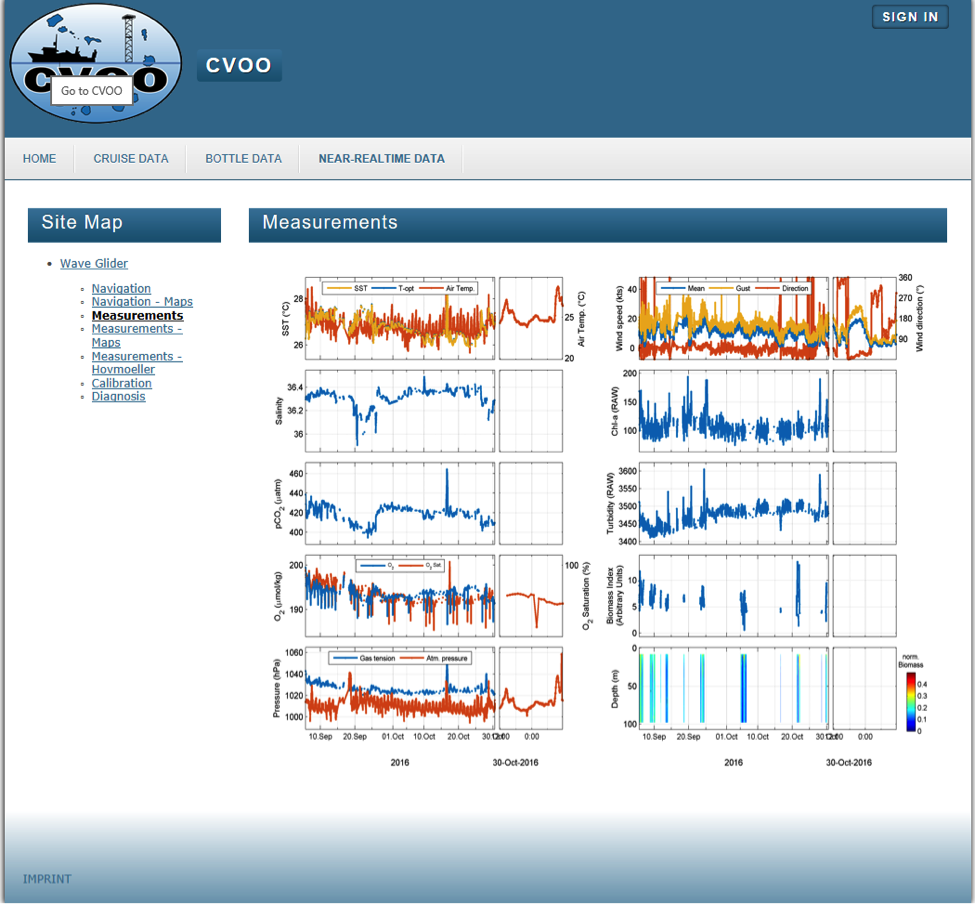
A second portal, which is part of the Cape Verde Ocean Observatory (CVOO), is geared more towards scientists and developers. It provides direct, exportable access to data from a range of systems from buoyancy gliders, buoys, ships and more, can be found at: https://portal.geomar.de/web/cvoo/wave-glider. It offers maps, measurements, in several different graphical forms, as well as calibration and diagnostic information. A quick glance at this page gives an excellent indication of how the mission is going and the kind of data being collected.
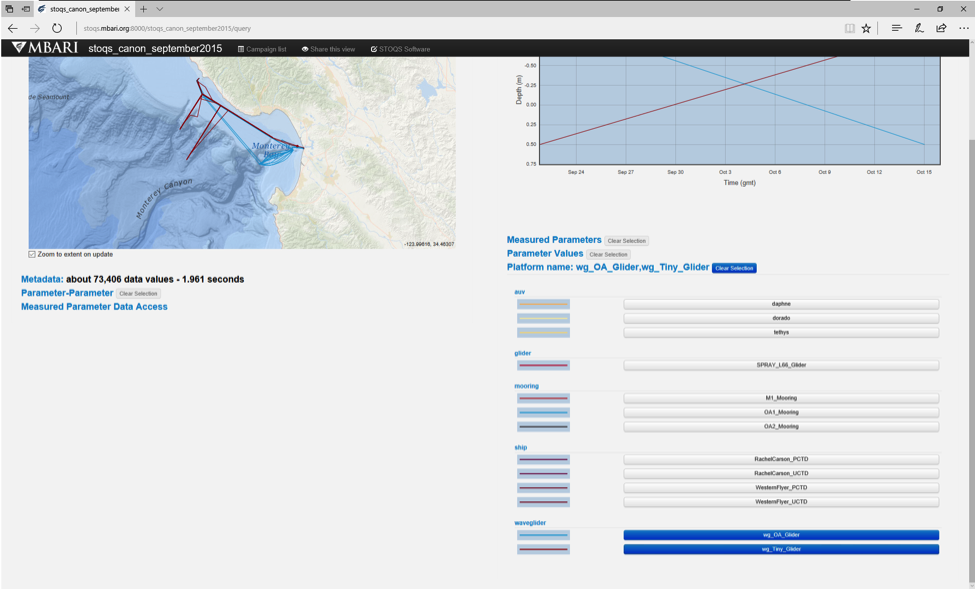
Monterey Bay Aquarium Research Institute (MBARI)
MBARI has three Wave Gliders, which they use for a variety of different missions, including chlorophyll measurements, acoustic hot spot missions, pCO2 measurements and more. Unlike OTN or GEOMAR, MBARI primarily groups their data collection by mission, not platform. This makes it easy to see all the data collected on a mission like CANON, though it can make it more difficult if you’re only interested in data from a specific platform, like the Wave Glider. Their data repository can be found here: http://www.mbari.org/products/data-repository/. Like the other portals, the MBARI data repository makes it easy to select different parameters, map measurements and vehicle tracks and get a good idea of what the data is showing with a quick glance.